Effective Inventory
The system calculates the inventory that will be used in the rest of the calculations.
Effective Inventory =
Inventory
+ Quantity on Purchase Order
- Quantity on Sales Order
+ Quantity in Transfer In
- Quantity in Transfer Out
Note: You can set up which document types (Purchase Order, Sales Order, ...) should be considered in the calculation. This is done in the Replen. Setup page, in the Effective Inventory FastTab.
Stock Cover Days
For items with Stock Coverage Days Profile
If the Stock Coverage Days Profile is used, the Stock Cover Days are dynamically calculated based on the next replenishment calculation day and the parameters that you defined in the Replen. Coverage Days Profile. The Warehouse Stock Cover Days and Store Stock Cover Days are calculated as follows:
Warehouse Stock Cover Days = No. of Days until Next Calculation Day + Inbound Whse. Handling Time + Coverage Buffer Days - Store Closing Days
Store Stock Cover Days = No. of Days until Next Calculation Day + Inbound Store Handling Time + Coverage Buffer Days - Store Closing Days
If the item is having the Enable Lead Time Calculation activated, the Inbound Location Handling Time is added on top of the Lead Time instead, that is, the Sourcing Location Lead Time for transfer and Vendor Lead Time for purchase replenishment. This makes up the Lead Time Coverage Period. The Stock Coverage Period is shifted to start a day after the stock arrives, that is, after the Lead Time Coverage Period.
For Purchase to Warehouse:
Lead Time Cover Days = Vendor Lead Time + Inbound Whse. Handling Time
For Purchase to Store:
Lead Time Cover Days = Vendor Lead Time + Inbound Store Handling Time
For Transfer to Store:
Lead Time Cover Days = Sourcing Location Lead Time + Inbound Store Handling Time
For example, a store is open from Monday to Saturday and has been set up to have 1 day of inbound location handling time and 2 coverage buffer days. The replenishment calculation is set up to be run every Monday and Wednesday. The selected vendor needs 2 days of lead time to deliver the items.
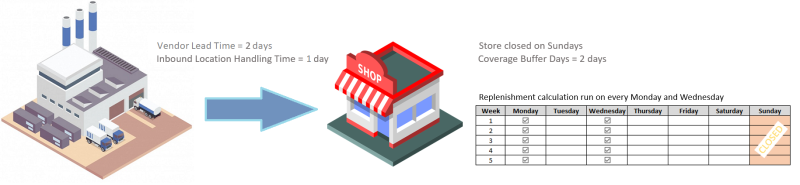
Replenishment calculation on Monday (01.06.2020) :
Lead Time = Vendor Lead Time + Inbound Store Handling Time
= 2 + 1
= 3 days
The stock will arrive 3 days later after 01.06.2020 which is on 04.06.2020.
Store Stock Coverage Period (Days) = No. of days until next calculation day + Store Coverage Buffer Days
= 2 (Tuesday until Wednesday) + 2
= 4 days
The Store Stock Coverage Period will start a day after the stock arrived and end 4 days later, which is from 05.06.2020 until 08.06.2020 (including the Store Closing Days).
Store Stock Coverage Days = Store Stock Coverage Period (Days) - Store Closing Days
= 4 – 1
= 3 days
Replenishment calculation on Wednesday (03.06.2020):
Lead Time = Vendor Lead Time + Inbound Store Handling Time
= 2 + 1
= 3 days
The stock will arrive 3 days later after 03.06.2020 which is on 06.06.2020.
Store Stock Coverage Period (Days) = No. of days until next calculation day + Store Coverage Buffer Days
= 5 (Thursday until Monday) + 2
= 7 days
The Store Stock Coverage Period will start a day after the stock arrived and end 7 days later, which is from 07.06.2020 until 13.06.2020 (including the Store Closing Days).
Store Stock Coverage Days = Store Stock Coverage Period (Days) - Store Closing Days
= 7 – 1
= 6 days
For items without Stock Coverage Days Profile
If the Stock Coverage Days Profile is not used, the system will use the Wareh Stock Cover Reqd (Days) field to replenish a warehouse and the Store Stock Cover Reqd (Days) field to replenish a store.
Stock Cover Days = Store Stock Cover Reqd (Days)
-or-
Stock Cover Days = Wareh Stock Cover Reqd (Days)
With Enable Lead Time Calculation activated for the item, the Stock Coverage Period is shifted to start a day after the stock arrives, that is, after the Sourcing Location Lead Time for transfer and Vendor Lead Time for purchase replenishment, which makes up the Lead Time Coverage Period.
For Purchase:
Lead Time Cover Days = Vendor Lead Time
For Transfer:
Lead Time Cover Days = Sourcing Location Lead Time
Note: When replenishing a warehouse, the system tries to use the Wareh Coverage Days Profile, or the Wareh Stock Cover Reqd (Days) field, if the profile for the warehouse is not defined. If both are empty, the system will look for the Store Coverage Days Profile, or finally, the Store Stock Cover Reqd (Days) field, if the profile for the store is not defined.
See also: Replen. Coverage Days Profile, Replenishment Batch Calculation Calendar, Lead Time Calculation
Suggested Quantity
The system suggests the quantity that the warehouse or the store needs according to the following formula:
System Suggested Quantity = Sum of Forecast Quantity on Required Stock Cover Days - Effective Inventory
Or, when Lead Time Calculation for the item is enabled:
System Suggested Quantity = Sum of Forecast Quantity on Required Stock Cover Days - Projected Effective Inventory
For items having Lead Time Calculation enabled, the System Suggested Quantity is calculated based on the Projected Effective Inventory, instead of the Effective Inventory. For more information, refer to the Projected Effective Inventory and System Suggested Quantity sections under Lead Time Calculation.
If the Effective Inventory is greater or equal to the System Suggested Quantity, the System Suggested Quantity is set to zero.
If there is no forecast entry found on a particular day within the stock coverage period, the forecast quantity on that day will be treated as zero, if the Forecast Exception Handling has been set to Use Zero Quantity in LS Forecast Setup. If the Use Average Usage Result option is used instead, the forecast quantity will then be set to the Average Daily Sale, which is calculated during the Replenishment Item Quantity calculation process, with the same approach as used in the calculation type Average Usage.
Example:
Condition:
- The warehouse has a stock coverage days of 5, covering from 01.01.2019 to 05.01.2019.
- Effective Inventory = 7
- Forecast quantity calculated from LS Forecast:
| Date | Forecast Quantity |
|---|---|
| 01.01.2019 | 5 |
| 02.01.2019 | 7 |
| 03.01.2019 | 6 |
| 04.01.2019 | 8 |
| 05.01.2019 | 8 |
| Total | 34 |
Result:
System Suggested Quantity = Total Forecast Quantity (34) - Effective Inventory (7) = 27
Note: Forecast Quantity (Upper) will be used to calculate the System Suggested Quantity, if Safety Stock Calculation is enabled.
See also: Basic LS Forecast Setup, Calculation Process for Average Usage
Cross Docking
If the Journal is to replenish the warehouse with cross docking to the stores, it is necessary to calculate how much should be cross-docked to the stores.
The regular Journal process calculates the System Suggested Quantity according to the Warehouse Stock Cover Days as the Journal replenishes the warehouse.
This additional process calculates the Quantity to Cross Dock for the store using the Store Stock Cover Days.
For items having Lead Time Calculation enabled, the Quantity to Cross Dock is calculated based on the Projected Effective Inventory, instead of the Effective Inventory. For more information, refer to the Projected Effective Inventory section under Lead Time Calculation.
Quantity to Cross Dock = Sum of Forecast Quantity on Store Stock Cover Days - Effective Inventory
Or, when Lead Time Calculation for the item is enabled:
Quantity to Cross Dock = Sum of Forecast Quantity on Store Stock Cover Days - Projected Effective Inventory
If the Quantity to Cross Dock is higher than the System Suggested Quantity, the Quantity to Cross Dock is set to System Suggested Quantity.
Example:
Condition:
- The warehouse has 5 days as Stock Coverage but the store has 3. The system calculates how much the store needs for 3 days.
- Store Stock Cover Days = 3, covering from 01.01.2019 to 03.01.2019
- Warehouse Stock Cover Days = 5, covering from 01.01.2019 to 05.01.2019.
- Effective Inventory = 7
- Forecast quantity calculated from LS Forecast:
| Date | Forecast Quantity |
|---|---|
| 01.01.2019 | 5 |
| 02.01.2019 | 7 |
| 03.01.2019 | 6 |
| Total (01.01.2019 to 03.01.2019) | 18 |
| 04.01.2019 | 8 |
| 05.01.2019 | 8 |
| Total (01.01.2019 to 05.01.2019) | 34 |
Result:
- Quantity to Cross Dock = Total Forecast Quantity from 01.01.2019 to 03.01.2019 (18) - Effective Inventory (7) = 11
- System Suggested Quantity = Total Forecast Quantity from 01.01.2019 to 05.01.2019 (34) - Effective Inventory (7) = 27
- The Quantity in the Purchase Order for the warehouse is 27, but when the Purchase Order is received into the warehouse, the staff cross-dock (pick) the 11 to be delivered by a Transfer Order to the store.
Note: If there is a Planned Sales Demand within the store stock cover period, the Quantity to Cross Dock is adjusted to reflect the Planned Sales Demand.
Planned Sales Demand
If there are Planned Sales Demand records for the required stock cover period (warehouse or store), the system sums the quantities from the Planned Sales Demand records, and the System Suggested Quantity will be adjusted to include the Planned Sales Demand quantity.
System Suggested Quantity = Sum of Forecast Quantity on Required Stock Cover Days + Total Planned Sales Demand Quantity - Effective Inventory
Or, when Lead Time Calculation for the item is enabled:
System Suggested Quantity = Sum of Forecast Quantity on Required Stock Cover Days + Total Planned Sales Demand Quantity - Projected Effective Inventory
Example:
Condition:
- The warehouse has a stock coverage days of 5, covering from 01.01.2019 to 05.01.2019.
- Effective Inventory = 7
- Forecast quantity calculated from LS Forecast and on top of that, there are Planned Sales Demand with additional quantity of 10 per day from 01.01.2019 to 03.01.2019:
| Date | Forecast Quantity | Planned Sales Demand | Forecast Quantity with Planned Sales Demand |
|---|---|---|---|
| 01.01.2019 | 5 | Additional Quantity of 10 | 15 |
| 02.01.2019 | 7 | Additional Quantity of 10 | 17 |
| 03.01.2019 | 6 | Additional Quantity of 10 | 16 |
| 04.01.2019 | 8 | 8 | |
| 05.01.2019 | 8 | 8 | |
| Total | 34 | 64 |
Result:
- Considering the Planned Sales Demand, the Total Forecast Quantity is updated from 34 to 64.
- System Suggested Quantity = Total Forecast Quantity with Planned Sales Demand (64) - Effective Inventory (7) = 57
See also: Planned Sales Demand
Reorder Point
If the field Reorder Point is greater than zero and System Suggested Quantity is less than the Reorder Point, the System Suggested Quantity is set to Reorder Point and Decision is set to Brought up to Reorder Point.
Maximum Inventory
If the Maximum Inventory field is greater than zero and the sum of System Suggested Quantity and Effective Inventory does not equal Maximum Inventory, the System Suggested Quantity equals Effective Inventory subtracted from the Maximum Inventory. The field Decision is set to Brought to Maximum Inventory.
Condition:
- System Suggested Quantity + Effective Inventory <> (not equal to) Maximum Inventory
Result:
- System Suggested Quantity = Maximum Inventory – Effective Inventory.